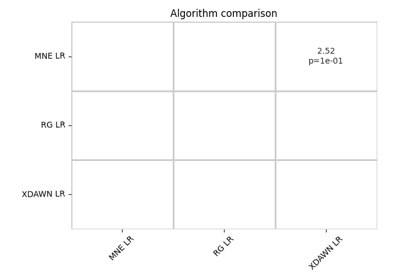
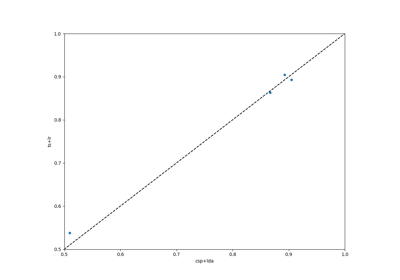
moabb.analysis.plotting.paired_plot# moabb.analysis.plotting.paired_plot(data, alg1, alg2)[source]# Generate a figure with a paired plot. Parameters data (DataFrame) – dataframe obtained from evaluation alg1 (str) – Name of a member of column data.pipeline alg2 (str) – Name of a member of column data.pipeline Returns fig – Pyplot handle Return type Figure Examples using moabb.analysis.plotting.paired_plot# MNE Epochs-based pipelines MNE Epochs-based pipelines Select Electrodes and Resampling Select Electrodes and Resampling Statistical Analysis Statistical Analysis