moabb.analysis.plotting.score_plot#

moabb.analysis.plotting.score_plot(data, pipelines=None, orientation='vertical')[source]#

Plot scores for all pipelines and all datasets

Parameters
  • data (output of Results.to_dataframe()) – results on datasets

  • pipelines (list of str | None) – pipelines to include in this plot

  • orientation (str, default="vertical") – plot orientation, could be [“vertical”, “v”, “horizontal”, “h”]

Returns

  • fig (Figure) – Pyplot handle

  • color_dict (dict) – Dictionary with the facecolor

Examples using moabb.analysis.plotting.score_plot#
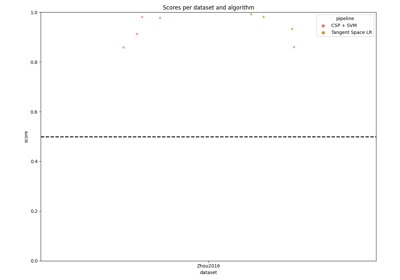
Examples of how to use MOABB to benchmark pipelines.

Examples of how to use MOABB to benchmark pipelines.
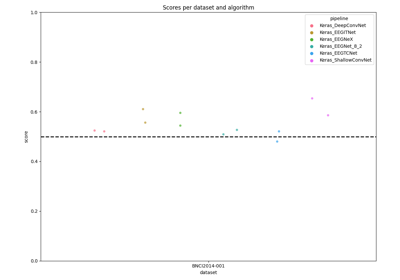
Examples of how to use MOABB to benchmark pipelines.
Benchmarking on MOABB with Tensorflow deep net architectures

Benchmarking on MOABB with Tensorflow deep net architectures
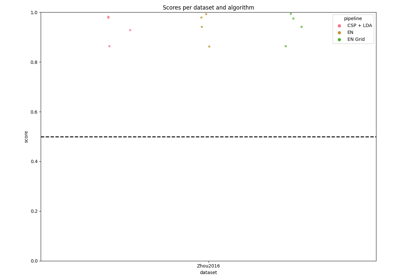
Benchmarking on MOABB with Tensorflow deep net architectures
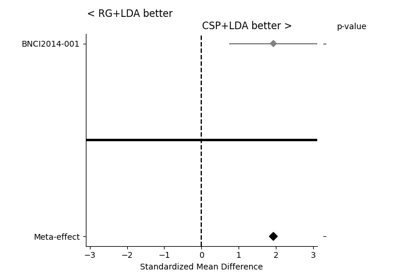
Benchmarking on MOABB with Braindecode (PyTorch) deep net architectures

Benchmarking on MOABB with Braindecode (PyTorch) deep net architectures

Benchmarking on MOABB with Braindecode (PyTorch) deep net architectures
Benchmarking with MOABB with Grid Search

Benchmarking with MOABB with Grid Search

Benchmarking with MOABB with Grid Search
Statistical Analysis

Statistical Analysis

Statistical Analysis