Note
Go to the end to download the full example code.
P300 Decoding
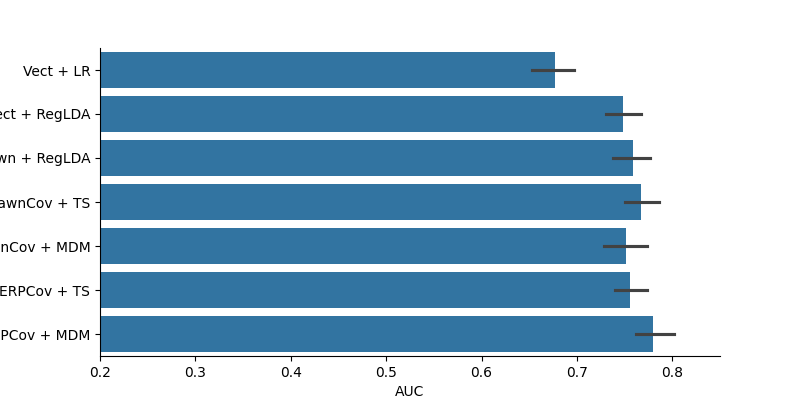
This example runs a set of machine learning algorithms on the P300 cats/dogs dataset, and compares them in terms of classification performance.
The data used is exactly the same as in the P300 load_and_visualize example.
Setup
# Some standard pythonic imports
import warnings
warnings.filterwarnings('ignore')
import os,numpy as np,pandas as pd
from collections import OrderedDict
import seaborn as sns
from matplotlib import pyplot as plt

# MNE functions
from mne import Epochs,find_events
from mne.decoding import Vectorizer

# EEG-Notebooks functions
from eegnb.analysis.analysis_utils import load_data
from eegnb.datasets import fetch_dataset

# Scikit-learn and Pyriemann ML functionalities
from sklearn.pipeline import make_pipeline
from sklearn.linear_model import LogisticRegression
from sklearn.preprocessing import StandardScaler
from sklearn.discriminant_analysis import LinearDiscriminantAnalysis as LDA
from sklearn.model_selection import cross_val_score, StratifiedShuffleSplit
from pyriemann.estimation import ERPCovariances, XdawnCovariances, Xdawn
from pyriemann.tangentspace import TangentSpace
from pyriemann.classification import MDM
Load Data
( See the P300 load_and_visualize example for further description of this)
eegnb_data_path = os.path.join(os.path.expanduser('~/'),'.eegnb', 'data')
p300_data_path = os.path.join(eegnb_data_path, 'visual-P300', 'eegnb_examples')

# If dataset hasn't been downloaded yet, download it
if not os.path.isdir(p300_data_path):
    fetch_dataset(data_dir=eegnb_data_path, experiment='visual-P300', site='eegnb_examples')


subject = 1
session = 1
raw = load_data(subject,session,
                experiment='visual-P300', site='eegnb_examples', device_name='muse2016',
                data_dir = eegnb_data_path)
Loading these files:

/home/runner/.eegnb/data/visual-P300/eegnb_examples/muse2016/subject0001/session001/data_2017-02-04-16_03_08.csv

/home/runner/.eegnb/data/visual-P300/eegnb_examples/muse2016/subject0001/session001/data_2017-02-04-15_58_30.csv

/home/runner/.eegnb/data/visual-P300/eegnb_examples/muse2016/subject0001/session001/data_2017-02-04-15_55_07.csv

/home/runner/.eegnb/data/visual-P300/eegnb_examples/muse2016/subject0001/session001/data_2017-02-04-15_47_49.csv

/home/runner/.eegnb/data/visual-P300/eegnb_examples/muse2016/subject0001/session001/data_2017-02-04-15_51_07.csv

/home/runner/.eegnb/data/visual-P300/eegnb_examples/muse2016/subject0001/session001/data_2017-02-04-15_45_13.csv


['TP9', 'AF7', 'AF8', 'TP10', 'Right AUX', 'stim']
['TP9', 'AF7', 'AF8', 'TP10', 'Right AUX', 'stim']
Creating RawArray with float64 data, n_channels=6, n_times=30732
    Range : 0 ... 30731 =      0.000 ...   120.043 secs
Ready.
['TP9', 'AF7', 'AF8', 'TP10', 'Right AUX', 'stim']
['TP9', 'AF7', 'AF8', 'TP10', 'Right AUX', 'stim']
Creating RawArray with float64 data, n_channels=6, n_times=30732
    Range : 0 ... 30731 =      0.000 ...   120.043 secs
Ready.
['TP9', 'AF7', 'AF8', 'TP10', 'Right AUX', 'stim']
['TP9', 'AF7', 'AF8', 'TP10', 'Right AUX', 'stim']
Creating RawArray with float64 data, n_channels=6, n_times=30732
    Range : 0 ... 30731 =      0.000 ...   120.043 secs
Ready.
['TP9', 'AF7', 'AF8', 'TP10', 'Right AUX', 'stim']
['TP9', 'AF7', 'AF8', 'TP10', 'Right AUX', 'stim']
Creating RawArray with float64 data, n_channels=6, n_times=30732
    Range : 0 ... 30731 =      0.000 ...   120.043 secs
Ready.
['TP9', 'AF7', 'AF8', 'TP10', 'Right AUX', 'stim']
['TP9', 'AF7', 'AF8', 'TP10', 'Right AUX', 'stim']
Creating RawArray with float64 data, n_channels=6, n_times=30732
    Range : 0 ... 30731 =      0.000 ...   120.043 secs
Ready.
['TP9', 'AF7', 'AF8', 'TP10', 'Right AUX', 'stim']
['TP9', 'AF7', 'AF8', 'TP10', 'Right AUX', 'stim']
Creating RawArray with float64 data, n_channels=6, n_times=30732
    Range : 0 ... 30731 =      0.000 ...   120.043 secs
Ready.
Marking edge at 30732 samples (maps to 120.047 sec)
Marking edge at 61464 samples (maps to 240.094 sec)
Marking edge at 92196 samples (maps to 360.141 sec)
Marking edge at 122928 samples (maps to 480.188 sec)
Marking edge at 153660 samples (maps to 600.234 sec)
Filteriing
raw.filter(1,30, method='iir')
Filtering raw data in 6 contiguous segments
Setting up band-pass filter from 1 - 30 Hz

IIR filter parameters
---------------------
Butterworth bandpass zero-phase (two-pass forward and reverse) non-causal filter:
- Filter order 16 (effective, after forward-backward)
- Cutoffs at 1.00, 30.00 Hz: -6.02, -6.02 dB
Epoching
# Create an array containing the timestamps and type of each stimulus (i.e. face or house)
events = find_events(raw)
event_id = {'Non-Target': 1, 'Target': 2}
epochs = Epochs(raw, events=events, event_id=event_id,
                tmin=-0.1, tmax=0.8, baseline=None,                                                                                     reject={'eeg': 100e-6}, preload=True,                                                                                   verbose=False, picks=[0,1,2,3])

print('sample drop %: ', (1 - len(epochs.events)/len(events)) * 100)

epochs
Finding events on: stim
1161 events found on stim channel stim
Event IDs: [1 2]
sample drop %:  1.5503875968992276
Classfication
clfs = OrderedDict()
clfs['Vect + LR'] = make_pipeline(Vectorizer(), StandardScaler(), LogisticRegression())
clfs['Vect + RegLDA'] = make_pipeline(Vectorizer(), LDA(shrinkage='auto', solver='eigen'))
clfs['Xdawn + RegLDA'] = make_pipeline(Xdawn(2, classes=[1]), Vectorizer(), LDA(shrinkage='auto', solver='eigen'))

clfs['XdawnCov + TS'] = make_pipeline(XdawnCovariances(estimator='oas'), TangentSpace(), LogisticRegression())
clfs['XdawnCov + MDM'] = make_pipeline(XdawnCovariances(estimator='oas'), MDM())


clfs['ERPCov + TS'] = make_pipeline(ERPCovariances(), TangentSpace(), LogisticRegression())
clfs['ERPCov + MDM'] = make_pipeline(ERPCovariances(), MDM())

# format data
epochs.pick_types(eeg=True)
X = epochs.get_data() * 1e6
times = epochs.times
y = epochs.events[:, -1]

# define cross validation
cv = StratifiedShuffleSplit(n_splits=10, test_size=0.25, random_state=42)

# run cross validation for each pipeline
auc = []
methods = []
for m in clfs:
    res = cross_val_score(clfs[m], X, y==2, scoring='roc_auc', cv=cv, n_jobs=-1)
    auc.extend(res)
    methods.extend([m]*len(res))

results = pd.DataFrame(data=auc, columns=['AUC'])
results['Method'] = methods

plt.figure(figsize=(8, 4))
sns.barplot(data=results, x='AUC', y='Method')
plt.xlim(0.2, 0.85)
sns.despine()
NOTE: pick_types() is a legacy function. New code should use inst.pick(...).
Total running time of the script: (0 minutes 10.990 seconds)